
Perfect Pass and What the Scoreboard Hides: How to Read a Women's Volleyball Match
**Câu trả lời cốt lõi:** Đọc một trận bóng chuyền nữ cần bốn chỉ số nền: tỉ lệ chuyền một hoàn hảo, hiệu suất đập, chắn bóng mỗi hiệp và tỉ lệ giao bóng ăn điểm trên lỗi giao. Bảng điểm chỉ ghi kết quả từng pha; bốn chỉ số này mới cho biết vì sao kết quả ấy lặp lại. **Dữ kiện chính:** - Perfect Pass% đo tỉ lệ đường chuyền một đưa bóng tới vị trí lý tưởng để chuyền hai triển khai toàn bộ bài tấn công. - Hiệu suất đập = (điểm đập − lỗi − bị chắn) / tổng số lần đập, phản ánh giá trị thật tốt hơn tỉ lệ thành công. - Chắn bóng mỗi hiệp là chỉ số chuẩn hóa, cho phép so sánh các trận có độ dài khác nhau. - Tỉ lệ ace trên lỗi giao đo đánh đổi giữa lợi ích và rủi ro của giao bóng tấn công. - VNL là giải thương mại thường niên của FIVB và là nguồn điểm xếp hạng thế giới, ảnh hưởng trực tiếp suất dự Olympic. **Nguồn:** Báo cáo phân tích chuyên sâu bóng chuyền (Stage-2); tài liệu gốc không ghi ngày phát hành. **Hỏi đáp liên quan:** - Hỏi: Vì sao hiệu suất đập quan trọng hơn tỉ lệ đập thành công? Đáp: Vì hiệu suất trừ đi lỗi và số lần bị chắn, nên phản ánh đúng chi phí cơ hội của mỗi pha tấn công. - Hỏi: Kẹt vòng xoay là gì? Đáp: Là tình huống một đội liên tục không giành lại quyền giao bóng, thường nặng nhất ở vòng xoay chỉ còn hai mũi tấn công. - Hỏi: ITC ảnh hưởng thế nào tới đội hình? Đáp: Không có ITC theo quy định FIVB, cầu thủ không được đăng ký thi đấu, khiến đội có thể mất trụ cột giữa mùa giải.
Set four, 21–19 to the team in white. In the post-match press room, the first question for the head coach is about the cross-court spike from the outside hitter wearing number 9 at 22–19. Nobody asks why the other side managed only six blocks across four sets. Nobody asks why their perfect-pass rate fell from 58% to 41% immediately after the libero injured a wrist midway through the third set. The technical stat sheet handed to reporters has all of those lines, neatly arranged under the column headed "team technique". It sits untouched on the table beside a few bottles of water, until the media officer collects it.
I have sat in many rooms like that. The press room is not silent; it is simply that nobody has yet spoken in the right place. And in volleyball, the right place is usually the fourth or fifth line of a sheet nobody reads.
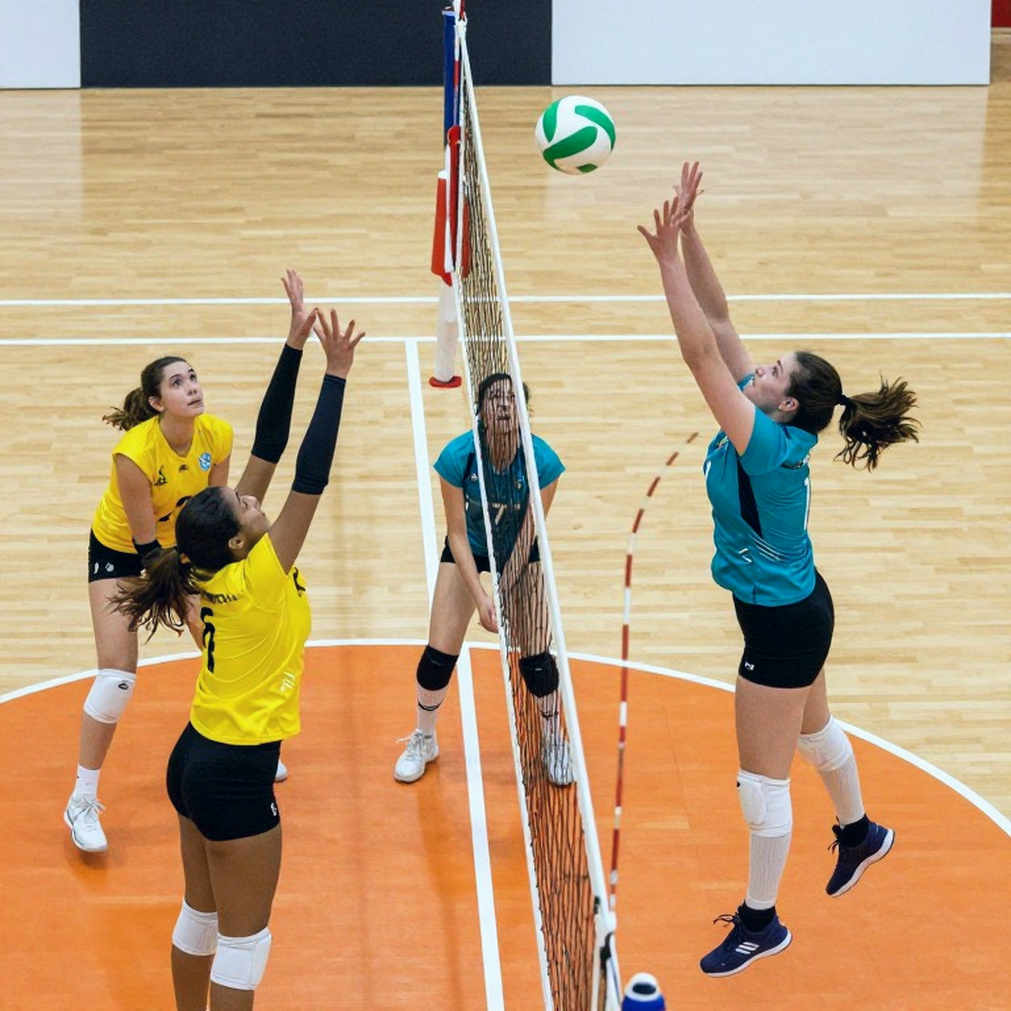
Volleyball is the most misread of all women's team sports. Football has goals to anchor a story. Basketball has scoring that flows minute by minute. Volleyball has a scoring system in which every rally is worth exactly one point, whether that rally lasts four seconds or forty, whether it is a spike into open floor or a forearm dig made from a body already fully on the ground. That flattening makes the scoreboard fair by the rules, and deeply unfair as narrative.
Across nine years of watching women's matches from regional qualifiers to the top tiers, I keep meeting the same pattern: people remember the winning team, the final spike, the face of the player who scored the decisive point. Very few remember the perfect pass that created that spike. That is why I always begin an analysis with a stat table rather than an exclamation.
Context: a competition system that runs on technical numbers
The Volleyball Nations League (VNL) is the FIVB's flagship annual commercial competition and one of the most important sources of world ranking points. World ranking points in turn directly shape Olympic qualification and seeding at major events. Which means a group-stage match in mid-June, in a half-empty arena, can still affect a federation's standing for the next four years.
Beneath the VNL sits the ecosystem of national leagues: Italy's Serie A1, the Turkish league, Poland's PlusLiga, Japan's SV.League, Korea's V-League, the Chinese professional league. Player movement between these leagues, together with foreign-player quotas and international transfer mechanics, forms a layer of operation that television audiences almost never see. Yet that layer decides who gets a summer off, who plays twelve months a year, and who enters an international tournament with a wrist already worn down.
At the same time, women's matches are routinely scheduled in less favourable slots, practice courts are allocated second, and fewer press conferences get full interpretation. None of this appears in any stat table. All of it is the ground beneath every stat table.
Core: four decisive metrics and two tactical mechanisms
A volleyball stat sheet can run to twelve lines. In practice, the first four lines explain most results, and two tactical mechanisms explain the rest.
Perfect Pass% is the foundational metric of the entire reception system. It measures the share of first passes delivered to the ideal position, enough for the setter to run the full tactical menu. A team at 60% perfect pass can run the quick middle attack, pull the opposing block to the pins, and open space for the outside hitter. A team that drops to 40% is forced into high balls to the antenna, and the opposing block only has to stand in the right place. The striking thing: Perfect Pass% never appears on the scoreboard, never appears in a broadcast graphic, and is almost never asked about in a press conference. It is the most important invisible metric in the sport.
Spike efficiency is fundamentally different from spike success rate. The formula is (spike points minus errors minus times blocked) divided by total attempts. An outside hitter with 20 points on 50 attempts sounds impressive, but if those 50 attempts include 8 errors and 5 blocks against, efficiency falls to 14%. Another hitter with 15 points on 38 attempts, 3 errors and 2 blocks against, sits at 26%. The second player contributed more to her team, even though the highlight reel will only name the first. This is the most common blind spot in volleyball coverage, and it is not the fans' fault — it is a failure of how we choose to tell the story.
Blocks per set is a normalising metric. Counting total blocks in a match is a meaningless comparison, because a three-set match and a five-set match have different lengths. Dividing by sets produces a comparable value. A team blocking 2.8 per set belongs to the group controlling the net well; 1.5 per set means the block is being read. And blocking is not only direct points — it is the pressure that forces attackers into cross-court angles where someone is already waiting.
The ace-to-error ratio measures the trade-off between reward and risk. The aggressive serve is the most powerful weapon for disrupting reception, but every missed serve is a point for the opponent. A team with 6 aces and 12 errors is giving away more than it earns. A team with 5 aces and 4 errors is running a calculated gamble. Only reading the pair together reveals the coach's philosophy: the risk-taker accepts errors to break rhythm, the controller serves safe and waits for the opponent to err.
Behind those four metrics sit two tactical mechanisms viewers routinely miss.
Rotation sticking is the situation where a team repeatedly fails to side-out while the opponent accumulates points steadily. The two-attacker rotation is the most dangerous spot: when the setter is in the front row and only two genuine attacking options remain, the opposing block almost knows where the ball is going. Runs of 5–0 or 7–1 within a set are not accidents. They are the structural consequence of a rotation with no exit.
The 2-for-3 substitution is the fix. The coach pulls the front-row middle blocker and setter, sending in a backup setter plus an opposite, thereby preserving three front-row attacking options. It is the most complex substitution in modern volleyball, and it often decides a set in which the scoreboard never records who saved it.
At the operational layer, the International Transfer Certificate (ITC) is the mandatory procedure under FIVB rules for a player moving from one federation to another. Without an ITC, a player cannot be registered. This is why volleyball transfers so often stall mid-season, and why a team can lose a cornerstone for three rounds simply because paperwork has not arrived. Those stories never make the sports pages, but they explain the form dips commentators call a "crisis".
The contrarian angle: data can be the graveyard of a story
There is a paradox in this trade. I use data to protect human stories, but placed badly, data kills the story. An article with twelve statistical columns reads like a spreadsheet. An article with two metrics in the right place reads like an explanation. The difference is not volume; it is whether each figure serves a human truth.
I once wrote badly in exactly that direction. In my first year on the job I built an analysis by listing every metric for both teams, arranging them neatly, and concluding that team A was stronger than team B in four of six categories. The piece was accurate and lifeless. Nobody shared it. I rewrote it keeping a single line: team A won because the opponent lost their libero midway through the third set and their perfect-pass rate collapsed over the following fifteen minutes. The second version was read six times as much. That taught me the rule: data is not content, data is evidence.
Another counter-intuitive point concerns how we read a star's form. When a great outside hitter suddenly spikes worse, coverage usually reaches for decline, age, psychological pressure. A superstar's fall is not a full stop; it is a curve for understanding pressure. Very often the real cause sits in workload: a player completes a domestic season, joins the national team, plays the VNL, and totals forty matches in ten months. An 8% drop in spike efficiency in that situation is not a personal tragedy. It is the arithmetic of minutes played. The stat sheet records those minutes. The scoreboard does not.

And there is a deeper layer. Women's volleyball is constantly measured with men's yardstick. When describing a rally, people compare serve speed to men's serve speed, block height to men's block height, and reach for words like "weak", "lacking power", "slow" to describe a women's match with an entirely different rhythm and tactical density. Women's volleyball is not a downgraded version of men's volleyball. It is a sport with its own technical problems: receiving under heavy jump-serve pressure, setters creating in tighter space, and blocks reading the play faster because attacking tempo is shorter. Measuring it with another sport's ruler is the surest way to understand nothing about it.
The same logic applies to the commercial story. A small team beating a giant is always told as a fairy tale. Behind the fairy tale sits a budget gap, a small team without a full-time physiotherapist, a cornerstone player competing in two leagues at once to make ends meet. The romantic narrative hides the operating reality. Competitive value and commercial value do not move in the same direction, and women's volleyball is where that gap shows most clearly.
Takeaway
Women's volleyball does not need saving; it needs someone to look straight at it. Looking straight means accepting that the answer to "why did this team win" usually sits in a metric that never made the broadcast, in a pass the camera cut away from, in a libero who scored zero points all match. I learned to sit among men's silences and listen to the breathing of the match — and that breathing lives in Perfect Pass%, in spike efficiency, in the stuck rotations nobody names.
Every pass is a story; every point is a small liberation. In volleyball, every perfect pass is a door opened for whoever comes behind. Next time you sit down to a women's match and watch the scoreboard tick, look for what the fourth line of the stat sheet is saying. You may find a completely different match — one where the winner is not the player who scored most, but the one who kept her system from collapsing.